It’s been raining a lot in the Philippines these past few weeks, and I’ve been wanting to write about this flood control network project for a while.
I mean, why not? Sobrang timely niya ngayon.
But because of our capstone, I couldn’t really find the time to write about it. Lol.
So here it is.
Where the Inspiration Came From
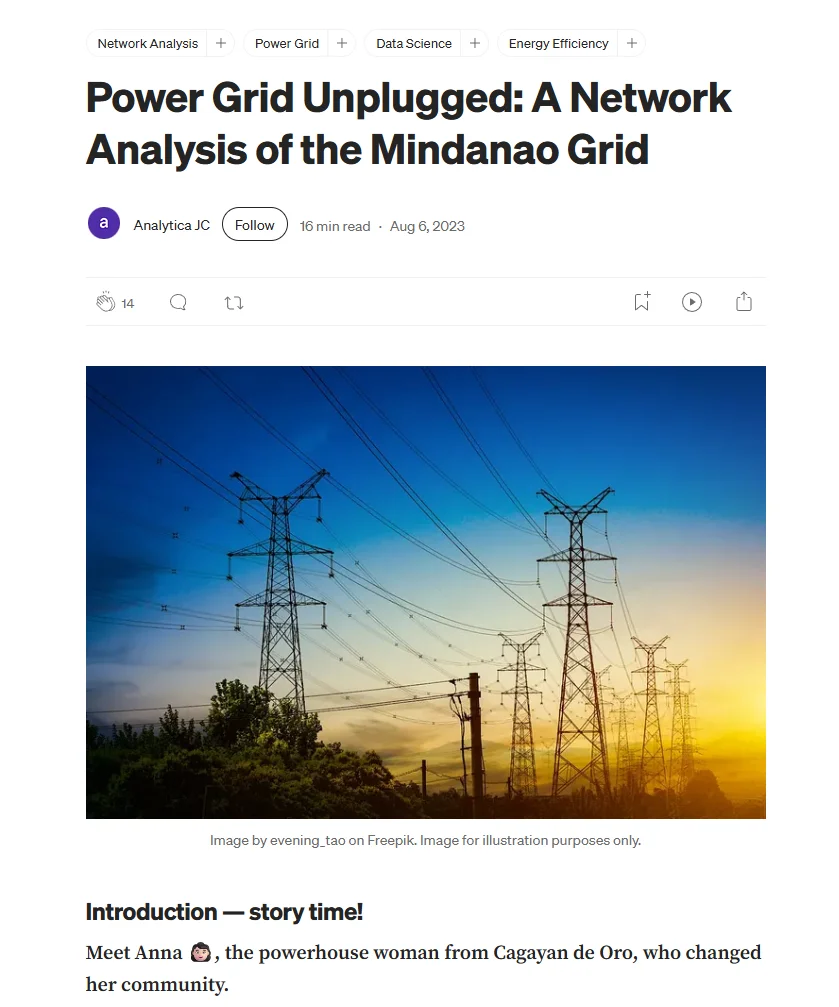
This project was partly inspired by the blog Power Grid Unplugged: A Network Analysis of the Mindanao Grid, which I also presented in one of our Network Science classes.
What I liked about that project was how something that normally looks like rows and columns of data could suddenly become much easier to understand once you start looking at it as a network.
Instead of looking at individual records separately, you start looking at how everything is connected.
And that eventually made me think:
What else can we look at as a network?
Selecting the Topic
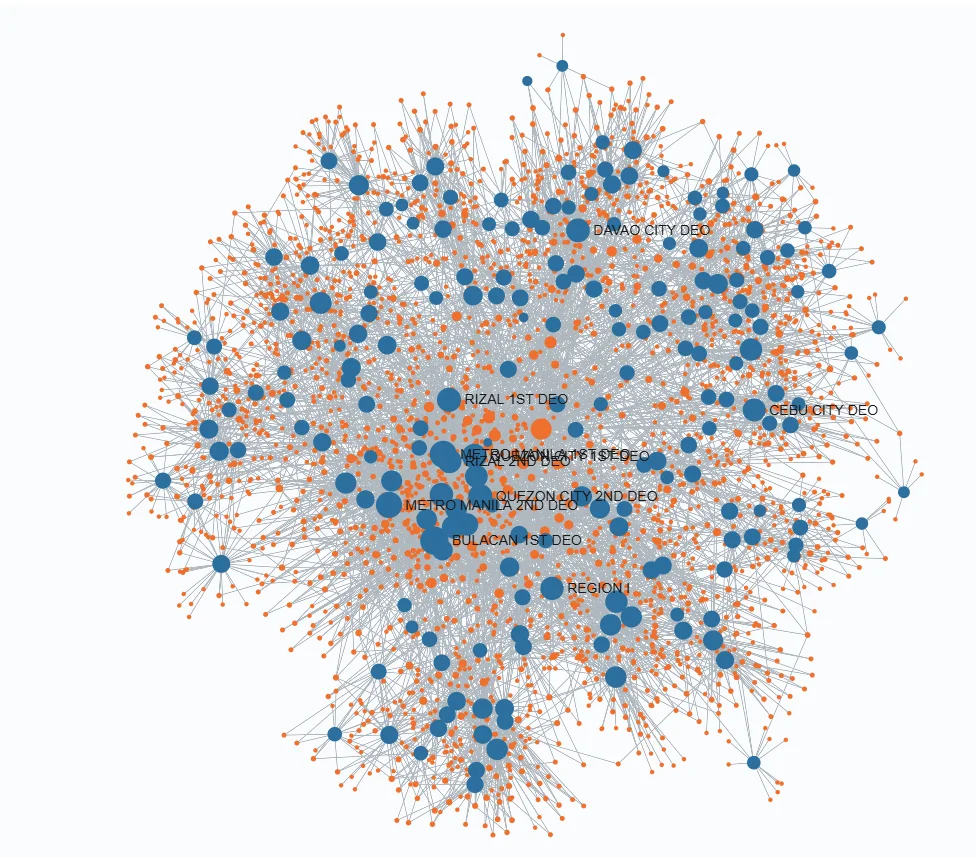
When we were deciding what project to work on for our Network Science class in my MSDS, one of our original ideas was to analyze the relationship between contractors and District Engineering Offices.
The idea was to look at how contractors grew from 2016 to 2025.
How many projects were they getting?
Which District Engineering Offices were they connected to?
Did some contractors become more dominant over time?
How did those relationships change from year to year?
Technically, it was interesting.
We could create a network.
We could show which contractors had many connections.
We could see which companies appeared across several engineering offices.
But there was one question we couldn’t answer strongly enough:
So what?
Okay, we can show that a contractor grew.
We can show that one contractor is connected to several engineering offices.
We can visualize which companies have more projects.
But what do we actually do with that information?
That question kept bothering us.
Then another idea suddenly came to mind.
Why not look for potentially overlapping projects?
And that gave us a much clearer answer to the “So what?” question.
If several flood control projects appear unusually similar, maybe because they are located near each other, were implemented around the same time, or have very similar descriptions, then maybe those projects deserve a closer look.
Not because the network automatically proves that something is wrong.
But because it can help answer a more useful question:
Which projects should we review first?
And that became the basic idea behind Project LUNOD.
Why Network Science?
At first, you might ask:
Why even use network science for this?
Why not just create a table, filter projects with similar coordinates, and call it a day?
Because the interesting part isn’t always one project by itself.
It is the relationship between projects.
A single flood control project might look completely normal when viewed independently.
But once you start connecting it to other projects based on shared characteristics, a different picture can emerge.
For example, imagine three projects.
Project A is located near Project B.
Project B has a very similar description to Project C.
Project C was implemented around the same period as Project A.
Individually, those observations might not mean much.
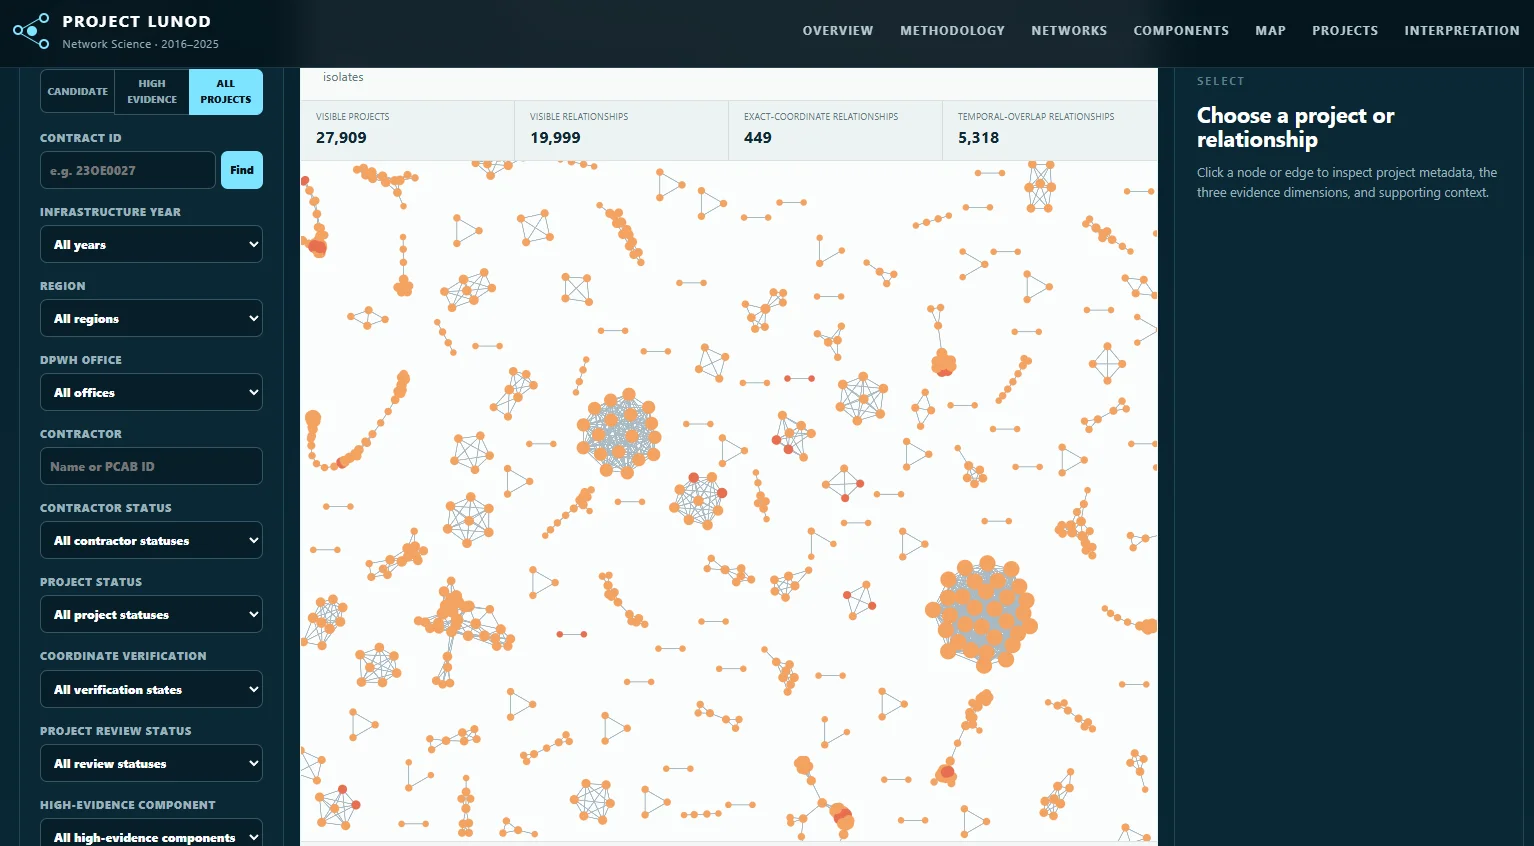
But once hundreds or thousands of these relationships are connected together, you can start seeing clusters, repeated patterns, highly connected projects, and groups that may not be obvious from a spreadsheet alone.
That is where network science becomes useful.
Instead of looking only at individual records, we can model the data as:
Nodes = flood control projects
Edges = relationships between projects
Then the question becomes:
Which projects are unusually connected to other projects, and why?
The network itself is not saying:
“This project is corrupt.”
What it can say is:
“These projects share enough characteristics that they may be worth reviewing together.”
That distinction became very important for us throughout the project.
Methodology: When Do Two Projects Become Connected?
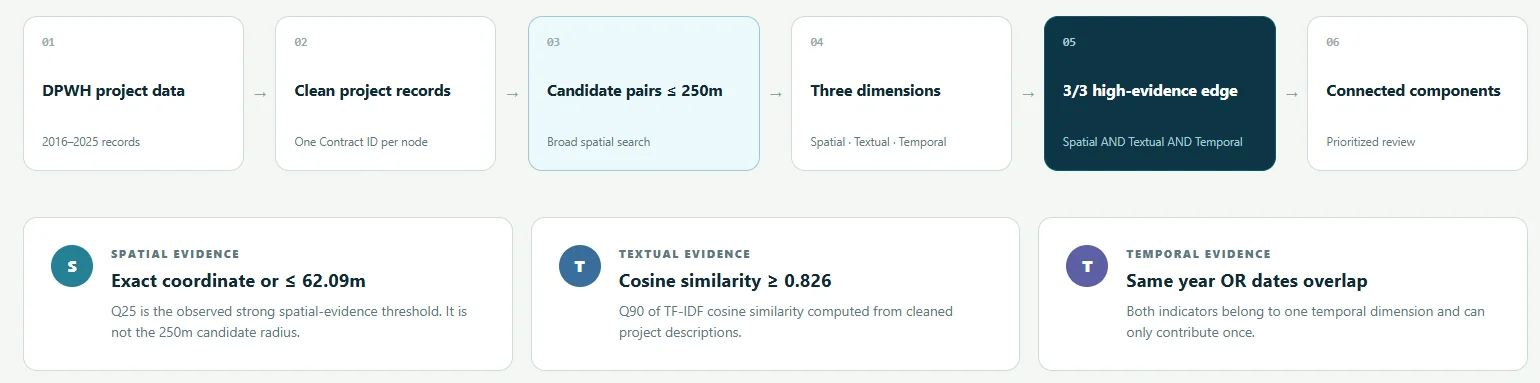
Of course, we couldn’t just connect every project to every other project.
If we did that, the network would basically become one giant spaghetti diagram, and it wouldn’t tell us anything useful.
So we needed to define what actually makes two projects related.
This was probably one of the most important parts of the project.
We started by thinking about the different ways two flood control projects could potentially be connected.
1. Location
The first and probably most intuitive one is location.
If two flood control projects are geographically very close to each other, that may be worth examining.
But being near each other doesn’t automatically mean they are duplicates.
Two projects can legitimately exist within the same area.
One might involve a drainage system.
Another could involve riverbank protection.
Another could be an extension or continuation of an existing structure.
So geographic proximity became an indicator, not a conclusion.
2. Project Description
We also looked at how similar the project descriptions were.
Government infrastructure project names and descriptions can sometimes follow very similar wording, so comparing them manually across thousands of records would be difficult.
Instead, we can use text similarity to help identify projects whose descriptions appear unusually alike.
For example, two projects might both refer to the construction or rehabilitation of flood control structures along the same river, barangay, or municipality.
Again, similarity doesn’t automatically mean duplication.
But when description similarity starts appearing together with other signals, it becomes more interesting.
3. Timing
Timing was another factor.
If two highly similar projects are located close to each other but were constructed many years apart, there could be a perfectly reasonable explanation.
Infrastructure deteriorates.
Projects get extended.
Flood control systems are expanded.
Areas may require additional protection after several years.
But if very similar projects appear within a relatively close time period, then the relationship becomes more relevant for review.
And this is where the network approach starts becoming useful.
Instead of saying:
“These two projects are close together, therefore something is wrong.”
we can ask:
“How many pieces of evidence connect these two projects?”
Location alone might be weak.
Description alone might be weak.
Timing alone might be weak.
But when several indicators point to the same pair of projects, that relationship starts becoming more interesting.
In Project LUNOD, the goal was not simply to create as many connections as possible.
The goal was to identify meaningful relationships.
And from those relationships, we could start looking at groups or clusters of projects that may deserve further review.
And Then You Look at the Network...
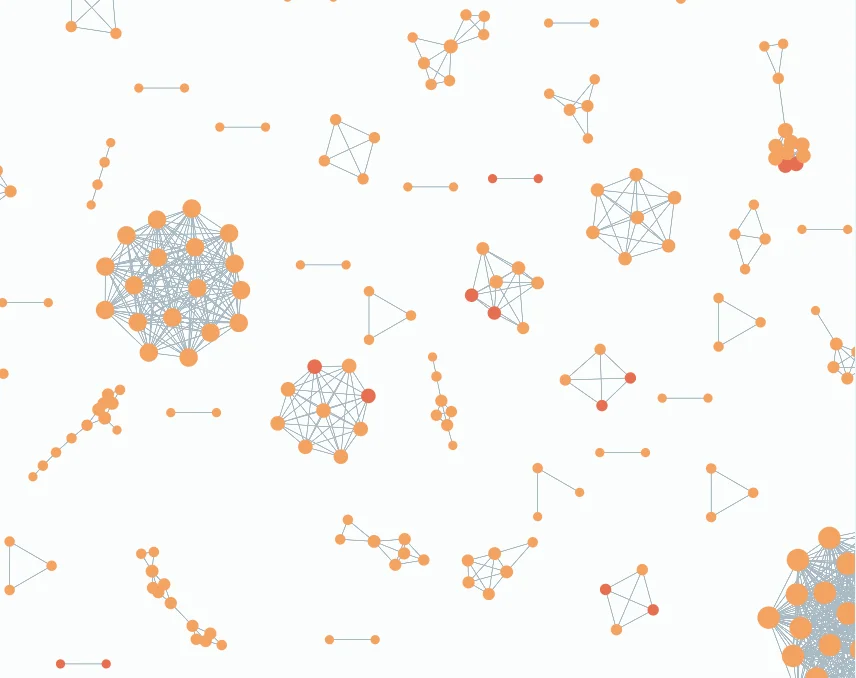
This is probably where things become interesting.
And this is also where I had to remind myself to be careful.
Because once you visualize everything, there are moments when you look at the network and think:
“Hello? Hindi ba obvious na may something dito?”
There were definitely patterns where my first reaction was:
“Wait, bakit ganito?”
And I think that is a very natural reaction when you see multiple projects appearing close together, sharing similar descriptions, or forming very dense groups in the network.
Especially given all the conversations surrounding flood control projects in the Philippines, it is very easy to jump from:
“This looks unusual.”
to:
“This must be corruption.”
But those are two very different statements.
And that is actually one of the biggest things I learned while doing this project.
Data can help you find where to look.
It doesn’t automatically tell you what happened.
A network can show that Projects A, B, and C are strongly related based on the criteria we defined.
But it cannot tell us, by itself, whether those relationships exist because of duplication, legitimate project phases, poor planning, data quality problems, procurement decisions, or something more serious.
And yes, personally, there are patterns that can make you raise an eyebrow.
Mapapaisip ka talaga.
But as a data scientist, that is also where you have to separate your reaction from your conclusion.
Project LUNOD was never meant to declare:
“These projects are corrupt.”
The question was much more practical:
“Given thousands of flood control projects, where should someone start looking more closely?”
And for me, that is where this project became much more interesting than simply building another network visualization.
Explore Project LUNOD Yourself
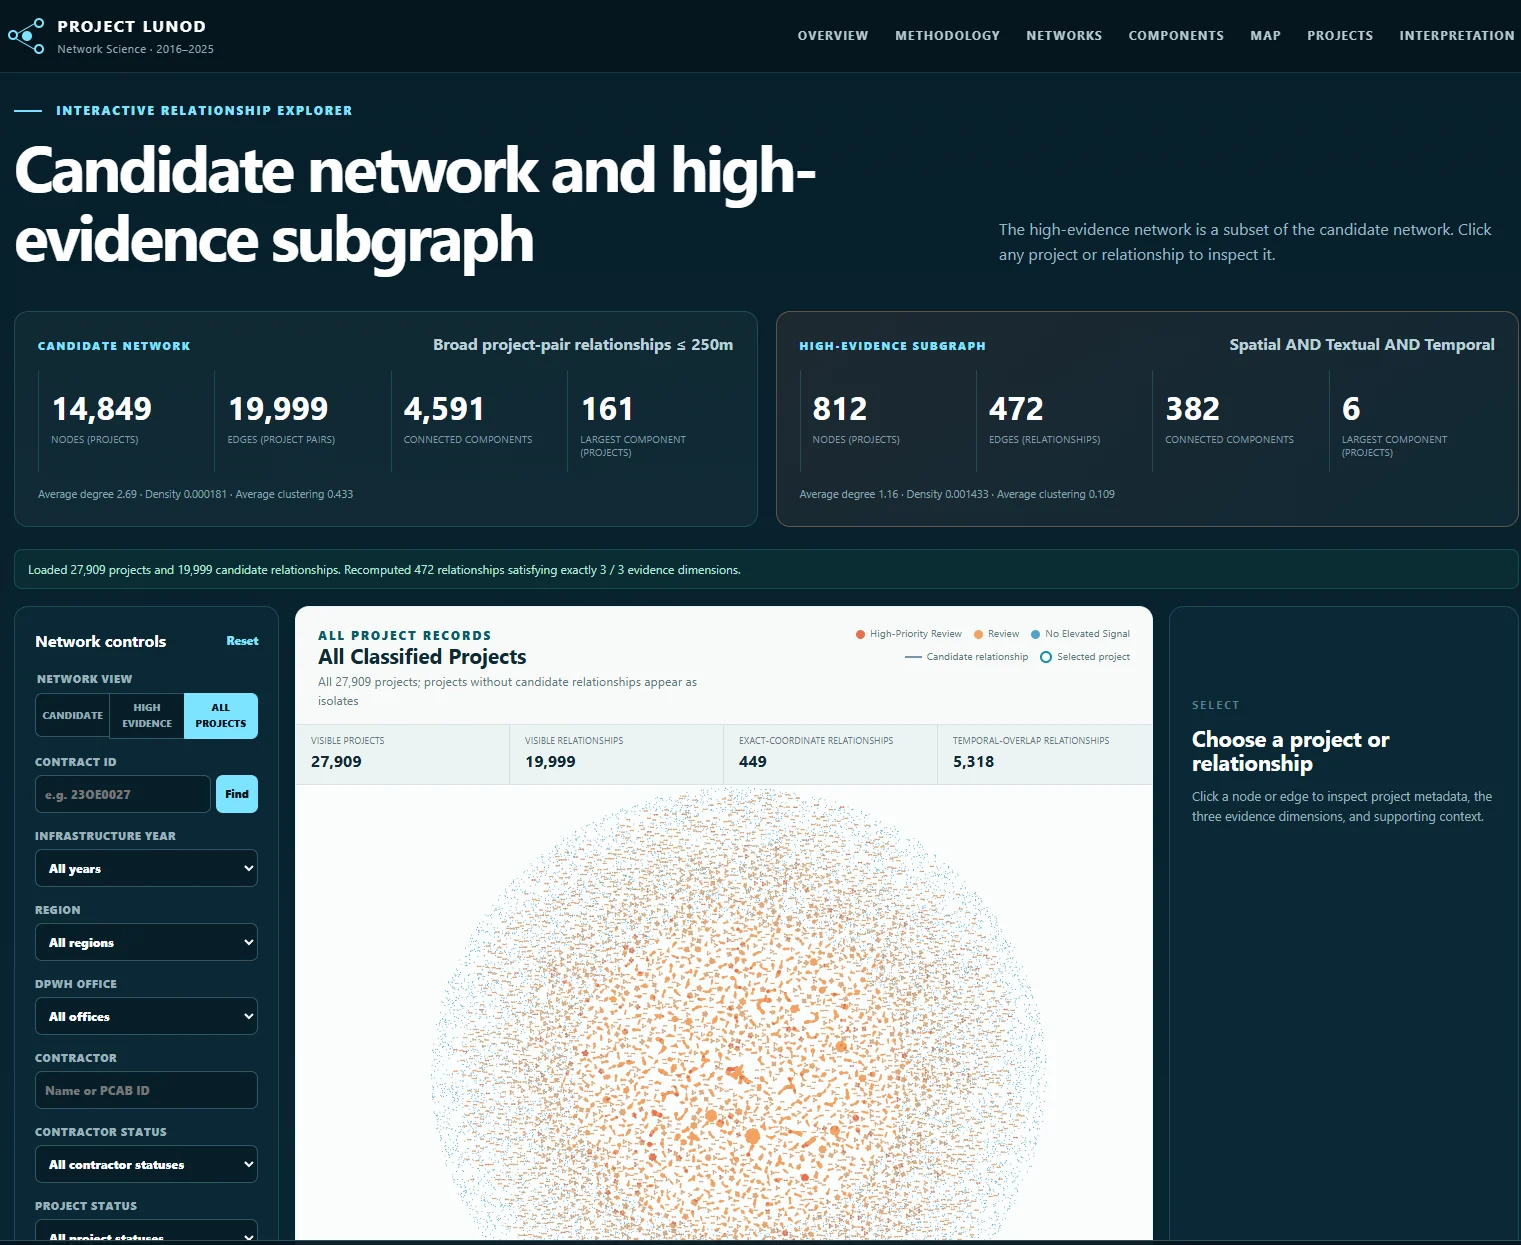
Of course, reading about the methodology is one thing.
Seeing the network yourself is another.
So instead of showing only screenshots here, I made Project LUNOD interactive.
You can explore it here:
https://project-lunod.jdzumelprojects.com/
You can explore the projects, look at the different relationships, inspect clusters, use the filters, and see why certain projects became connected in the network.
And this is probably the part I like most about the project.
I don’t necessarily want to tell you what you should conclude from every cluster.
Explore it yourself.
Click around.
Look at the projects.
Look at the relationships.
Look at the map.
Maybe you’ll see something completely normal.
Maybe there is a reasonable explanation.
Maybe you’ll find something interesting.
Or maybe, like me, you’ll encounter a cluster and suddenly think:
“Wait... bakit ganito?”
And that is really what Project LUNOD is about.
Not proving wrongdoing.
But using data to help us ask better questions and perhaps showing us where those questions are worth asking first.
Maybe This Is One Small Way I Can Help
Sometimes I also ask myself what I can actually do for the Philippines.
I am not an auditor.
I am not an investigator.
I am not someone who can decide whether a government project is right or wrong.
What I can do is work with data.
And maybe, for now, this is one small way I can help.
To organize the information.
To make relationships easier to see.
To make something that normally sits inside thousands of rows of data easier for people to explore.
To ask more questions.
And hopefully, to help other people ask better questions too.
Because sometimes the first step is not immediately having the answer.
Sometimes it is simply knowing:
Where should we look?
What should we ask?
And what deserves a closer look?
For now, maybe that is what I can contribute.
Where Can Project LUNOD Go From Here?
I also want to improve Project LUNOD.
Honestly, I still don’t know exactly where to take it next.
Right now, the project focuses specifically on flood control projects.
But one idea that keeps coming back to me is:
What if we expand this to the whole DPWH project dataset?
Not just flood control.
Roads.
Bridges.
Buildings.
Drainage.
Other infrastructure projects.
Basically, the larger DPWH project network.
Would we see similar patterns?
Would some projects appear repeatedly connected across locations, descriptions, contractors, engineering offices, or time periods?
Would there be relationships that are difficult to notice when we only look at one project category at a time?
Could we bring back our original contractor and District Engineering Office idea and combine it with the project similarity network?
Maybe one network could show the projects.
Another could show contractors.
Another could show engineering offices.
And then somehow connect all of them together.
Honestly, I don’t know yet.
And I think that is also what makes me want to continue working on it.
There are still a lot of things that can be improved.
Better project matching.
More contextual information.
Better ways of explaining why two projects were connected.
Contractor relationships.
District Engineering Office relationships.
More project categories.
Maybe even the entire DPWH project dataset.
Project LUNOD is still imperfect.
There are limitations in the data.
There are limitations in the methodology.
And there are definitely things I would do differently if I started again.
But maybe that is also the point of building something like this.
You start with one question.
Then the result gives you ten more questions.
And maybe one of those questions leads somewhere useful.
Before I End This
Project LUNOD was not something I built alone.
This project was created by CPT9, MSDS, as part of our Network Science work at the Asian Institute of Management.
A lot of the ideas in this project came from discussions with my CPTmates.
We questioned our original direction.
We challenged the “So what?”
We refined the methodology.
We figured out how we could turn thousands of flood control project records into something people could actually explore and understand.
So to my CPT9 teammates, thank you for all the discussions, disagreements, debugging, random ideas, and those moments when one question suddenly changed the whole direction of the project.
And of course, thank you to our Network Science professor, who pushed us to think beyond simply creating a technically interesting network and continuously ask the more important question:
“So what?”
That question eventually became one of the reasons Project LUNOD turned into what it is today.
The analysis, methodology, and network were developed as an academic project by CPT9 MSDS.
The analysis, methodology, and network were developed as an academic project by CPT9 MSDS. The personal reflections, interpretations, and opinions expressed in this blog are mine alone and do not necessarily represent the views of my CPTmates, our professor, or the Asian Institute of Management.
And if you haven’t tried it yet:
Explore Project LUNOD
https://project-lunod.jdzumelprojects.com/
Maybe you’ll find nothing unusual.
Maybe you’ll find something interesting.
Maybe you’ll leave with even more questions than when you started.
Either way, that is the point.
Look at the data. Ask questions. And decide what is worth looking into further.